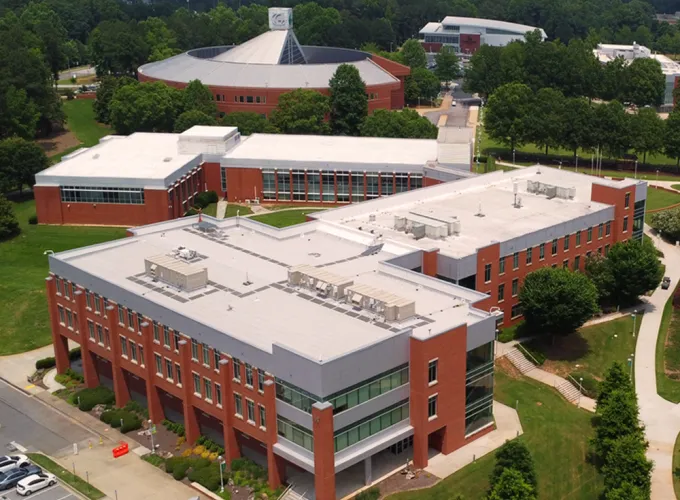
Fast Facts
Georgia Gwinnett College is a dynamic learning community where student engagement and faculty-student mentoring are the hallmark. Small classes, student support, high-tech classrooms and flexible scheduling make success possible for everyone at GGC.

Distinctions
Established in 2005 as the nation's first four-year public college founded in the 21st century, and the first four-year public institution created in Georgia in more than 100 years. Learn more about GGC's history.
Ranked by U.S. News & World Report magazine as the most ethnically diverse Southern regional college (2015-25).
Silver 2024-2025 Military Friendly® School designation, indicating support of military students with dedicated resources to ensure success in the classroom and after graduation.
Academics
Flexible scheduling (weekday, evening and weekend classes) to accommodates today's busy students
Student Support and Faculty Engagement
- Student Success programs ensure that all GGC students, regardless of their academic preparation, have comprehensive support to develop skills needed to succeed.
- Faculty mentors work closely with students throughout their years at Georgia Gwinnett College.
- Faculty are available to students via cell phone for questions and academic assistance outside the office.
- Student resources include resume review and interview prep through Career Services and mental health counseling through Counseling and Psychological Services (CAPS).
- Students who have attained a 3.5 GPA or higher are eligible to join the Honors Program.
Student Affairs
Student Life support for a full range of student-engaging events.
Student Demographics
| Fall 2024 | Number | Percentage |
| Headcount | 12,782 | -- |
| Enrolled Full-time | 8,294 | 64.89% |
| Enrolled Part-time | 4,488 | 35.11% |
| Dual Enrollment (high school and college) | 702 | -- |
| Freshmen | 5,884 | 46.03% |
| Sophomore | 2,862 | 22.39% |
| Junior | 1,896 | 14.83% |
| Senior | 2,140 | 16.74% |
| Transient | 23 | 0.18% |
| Female | 7,647 | 59.83% |
| Male | 5,135 | 40.17% |
| Asian | 1,625 | 12.71% |
| Black / African-American | 4,428 | 34.64% |
| Hispanic / Latino (of any race) | 3,756 | 29.39% |
| American Indian / Alaska Native | 28 | 0.22% |
| Native Hawaiian / Pacific Islander | 18 | 0.14% |
| White | 2,309 | 18.06% |
| Two or more races | 507 | 3.97% |
| Unknown | 111 | 0.87% |
| Under 18 years | 685 | 5.36% |
| 18-22 years | 8,221 | 64.32% |
| 23-34 years | 3,264 | 25.54% |
| 35-44 years | 363 | 2.84% |
| 45 years and over | 249 | 1.95% |
| Average age | 22 years | -- |

Technology
Students have access to technology that supports their academic goals – in the classroom and online.
